Contextual debugging
The Contextual Debugging Tool gives you an instant view of webpage metrics and files being rendered. Activate the Dari Contextual Debugger by adding ?_debug=true or &_debug=true (depending on the query string) to a page URL. The Contextual Debugger provides a view of the load time, in milliseconds, for each module (JSP) on the page. Scaled color hotspots provide a clear illustration of the slowest loading modules on the page. The larger and darker red the circle, the slower the load time. In the example below, the 90 millisecond load time is the slowest on the page.
Getting context
Hover over a hotspot on the page to see specific data for that module in the top right of the page. Click on a hotspot to learn more about the event.


Overview of page
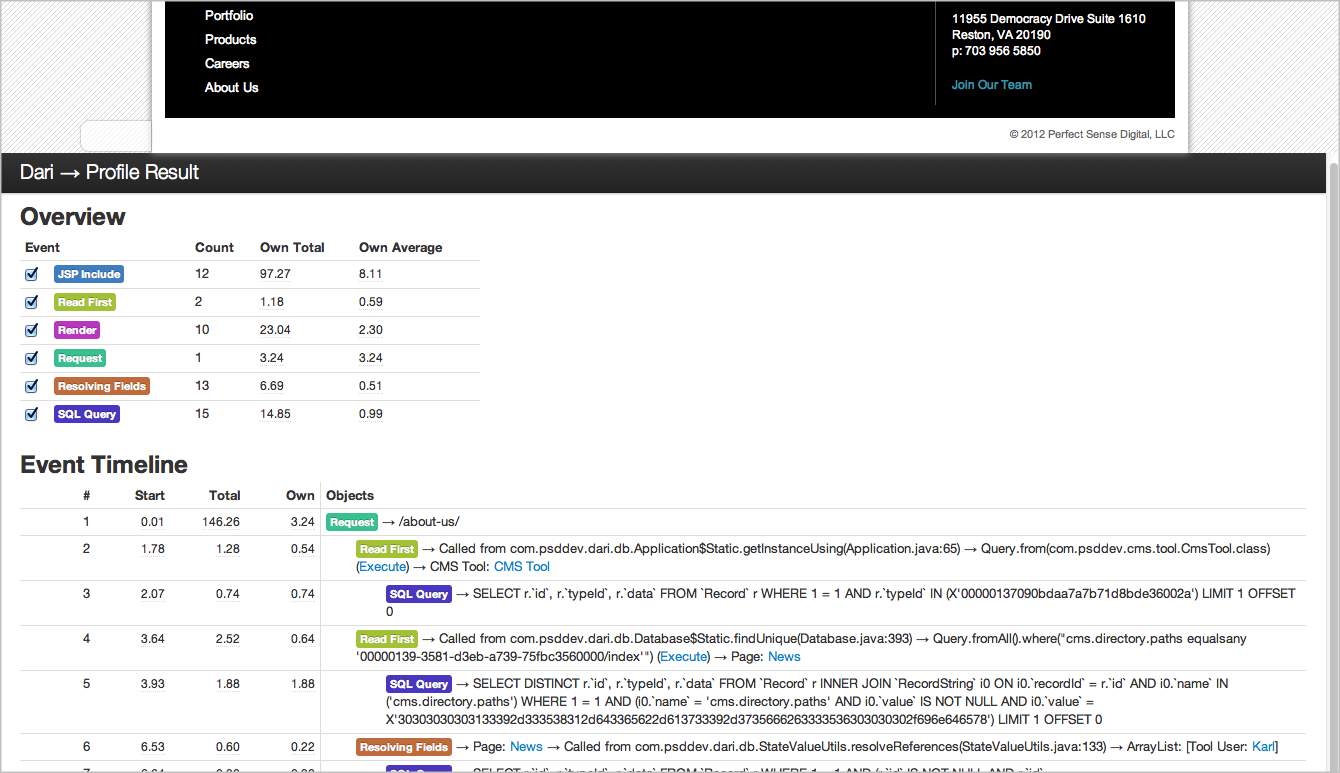
At the bottom of the browser window is an ordered waterfall view of all items loaded on the page. There is a color-coded overview of the includes and events.


Finding code
Clicking on a specific hotspot sends you to the full waterfall view of the page load at the bottom of the browser window. The selected hotspot will be found automatically. For example, clicking on the “90 milliseconds” hotspot brings you to the page_js_start.jsp.


View code
Hover over an area of the page to show the JSP file being rendered. The path to the file is in the upper right so you can find code visually without searching through your project.

